We can also talk about the Management Information System, Data Ware House (DWH), Business Intelligence (BI) or anything else; in any case, it is a management decision-making support system. For a better understanding, it is a system providing information about the state of the company – financial, material and operational, also necessary for the right management decisions at a given time.
As part of its day-to-day operation, the company uses a business-transaction, ERP system: for example Billien and others. The transaction system provides the day-to-day running of the company and covers its key processes: contractual relationships, billing, warehouse management, readings at delivery points, order management, for example, the exchange of electric meters and so on.
DWH is not a transaction system. So, WHAT is it, actually? Let’s take a closer look at DWH…
It is important to distinguish between data, information and knowledge. Data are individual facts recorded in the database – male, Jozef, 190, 95, 43, blue, black, secondary. Data simply exist on their own and do not provide any relevant information. If we put data into context – gender, name, height, weight, age, eye colour, hair colour, achieved education – we get information about the person. We see that he is a middle-aged man, relatively tall with a corresponding weight. Such information is important to somebody in certain situations, let’s say to the head of a human resources department in the process of recruiting a new employee.
We can note that not all of the data available comprise the necessary information. The colour of eyes and hair, apparently, when a new person is recruited into a company is not important. Information on age and weight can be important in physically demanding occupations, and information on the achieved education is important almost always. It is clear, therefore, that one data source creates various information needed in different situations. If we collect the information in the necessary structure, we get the knowledge. Knowledge is therefore based on related information – for example, on the basis of information on the age and the weight of many people, we may notice (we gain knowledge) that weight with age in most people is growing – of course, there may be exceptions. Based on knowledge it is possible to make a decision – although only as obvious as adjusting the diet and starting to practice.
Or, based on some knowledge of the company’s financial situation, we can take credit at the bank, recruit or fire other people, launch an investment project, etc., or make a whole series of decisions. It is clear that if decisions are made without the necessary knowledge, or at least information, the consequences can be quite bad.
Let’s give another example: based on information on the consumption of gas in certain types of delivery points over a period of time – for example, for several years – we can obtain the knowledge that there is a clear dependence between outdoor temperature and the amount of consumption. Such knowledge can be further used in forecasting consumption based on anticipated temperature. And if we can – quite accurately – predict how the consumption of a large group of delivery points, we can customize in advance the conditions of the distribution network: for example, the status of regulation stations and gas storage tanks.
So, based on knowledge (temperature versus consumption, prediction), we will make a certain decision (setting the ratios on the network).
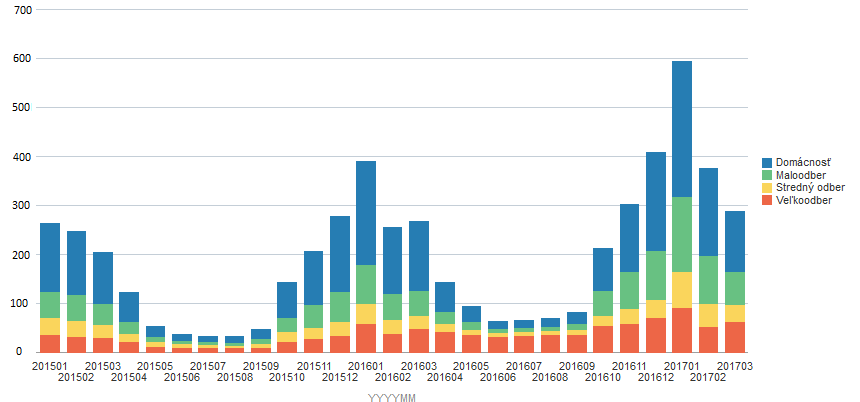
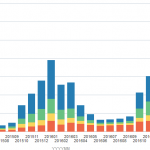
But information on the amount of consumption may not be enough, we need more detailed information: what is the consumption according to the type of delivery point, i.e. household, small, medium and large consumption.
The graph is composed on the basis of data on the consumption of the given type of delivery points. Based on the aforesaid graph/report – that is, information – we can derive knowledge of the seasonality of consumption based on the season, i.e. the temperature. At first glance, it is also clear that household consumption is subject to seasonal effects much more than, for example, the consumption of delivery points in the category of large consumption, which ensues from the obvious fact that gas is used in homes for heating.
Transactional online systems, e.g. Billien, used by the company daily in operations – specific warehouses, contracts, orders, deductions, billing, complex day-to-day computing operations performed at the market operator – produces large amounts of data every hour and minute in a variety of forms (numbers, texts, images, binary files, etc.) and in mutual relationships: data from which the necessary information can be obtained.
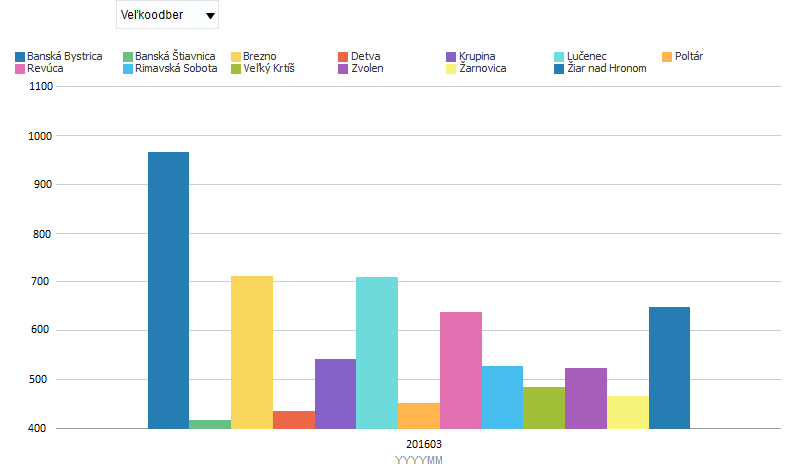
The question, of course, is how to get information from the huge amount of data. Example: A manager in the measurement department needs summary information on electricity consumption of delivery points in the large consumption category in the region of Banská Bystrica in March 2016, i.e. delivery points with annual consumption over 400 MWh per year – which is a specific requirement to extract information from a lot of data. Or yes, we can say that this is a classic report.
So you just need to know the data model of the transaction application perfectly: just have a good knowledge of SQL, have access to the production database, write an appropriate database query and run it at the right time so that we do not affect the operation of the transaction system.
Or we can use DWH, or BI, click a few times and a report will be displayed in a few seconds.
So the basic function of DWH and BI is to provide different views of the data depending on what information we need to obtain.
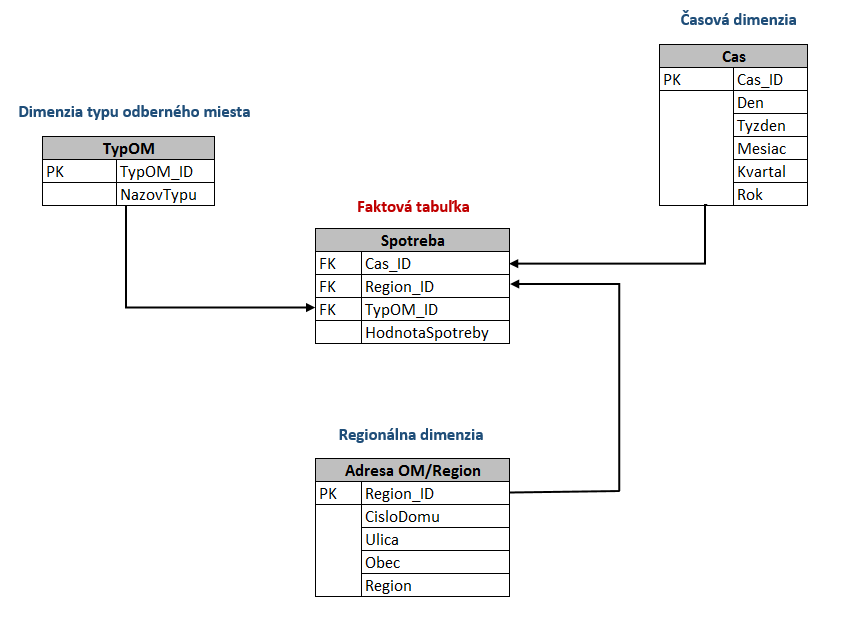
These examples have one thing in common: they look at one type of data (consumption) from different perspectives – in terms of time, region or type of consumption (household, large consumption) – they provide different information derived from the same facts. Within DWH, we have a specific fact stored, which is linked to several dimensions. As a matter of fact, consumption is uniquely associated with a delivery point type and is located at a specific address in the given region. Consumption, of course, is measured in time or, at a certain time interval (days, years, etc.). Time, address/region, type of delivery point are the dimensions through which we look at the fact (consumption). The dimensions thus create a context that gives us specific information from facts/data.
The data structure of DWH consists of facts, respectively, or fact tables, associated with dimension tables. Fact tables and dimension tables comprise the STAR scheme and this represents the core of the entire system.
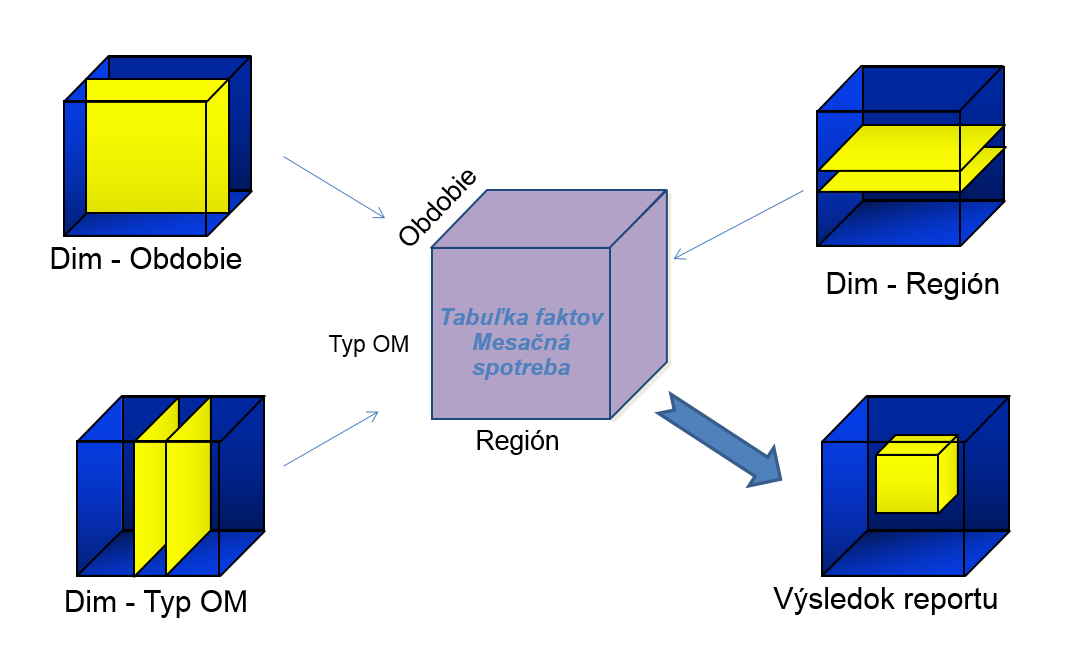
There is often a requirement to aggregate outputs, e.g. according to time. We want to know the total consumption of all delivery points for the whole year according to regions. It would also be quite reasonable to divide the total annual consumption according to regions into quarters or months. And then go back to summary annual consumption. Do we instead prefer to see annual / quarterly / monthly consumption according to the type of delivery point? Or from the total amount do we want to only select a specific region and then divide the total consumption within the selected region into individual districts, municipalities or even streets?
It is almost impossible to generate reports on the spot according to these requests directly from a transaction system database or even from multiple source systems. Each request would require the adjustment of the relevant selection criteria in the SQL command and, of course, a competent person/ people who understands the whole thing; and which a company can use elsewhere and in a definitely more efficient way.
The DWH is innately tailored for reporting based on various criteria: we get the answer within a few seconds. The principle of the OLAP cubes allows you to perform the necessary aggregations in advance, for example in the time dimension.– If, let’s say, we have daily consumption for delivery points in different regions available, the DWH automatically calculates and saves weekly, monthly and annual sums of consumption according to region, and when requested to generate a report, it only “pulls them out” into the report, which radically increases the speed.
DWH, or BI provides the user with numerous tools for the preparation of reports. When data is safely stored in the STAR schemes or other similar structures, we can put together reports as necessary using UI tools. It is possible to set multiple access levels to different types of data and to set access security.
Reports can be predefined or optional. The first ones can be run by a DWH user directly and create others as needed. Dimensions and facts create a large number of combinations, and it is possible to put together a report for each individual dimension combination.
A special form of reports is dashboards. These are minimalist reports showing the actual status of a certain quantity against the set criteria: KPI (Key Performance Indicators). An example is the trend of sales development over time. The company management for each period of the year will set expectations, then compared to the actual status and displayed in a transparent form within the dashboard. In this way, the manager in charge has a real-time, instant information, which can be used to make decisions operatively.
Simply through the ETL process, i.e. through the process of Extractation, Transforming, and data Loading. Data will be downloaded from multiple source systems (Extract), modified and adapted as needed (Transform) and subsequently stored in the STAR DWH (Load) schemes. Data transformation is typically needed in cases where one entity – such as an invoice – is represented in different ways in multiple systems.
In preparing the DWH it is necessary to define information requirements/reports/ dashboards and identify the data sources that make up the information. Through specific tools, the required data from source systems are extracted, cleaned, transformed, and stored in prepared DWH structures. The process of creating tools for extracting, cleaning, transforming, and storing data is unique and relatively complex for each project and represents a large part of the DWH creation project.
The implementation of the DWH database through ETL processes has two phases in the most cases: the load will be executed in the DWH implementation, when the DWH uploads historical data from one or several systems over the required history period. The initial load is a one-time demanding process that is not repeated.
During the DWH operation, new data that originated in source systems during the previous day are recorded repeatedly and on a daily basis at a defined time (usually at night). Historical data do not change in this case.
This ensures that the DWH data are always up to date as well as accurately and faithfully represent the true status of the company.
The DWH collects data from multiple sources and provides comprehensive information to anyone who needs and uses it. Transactional systems required for running a business: CRM, invoicing and accounting, warehouses, HR, etc. live their lives, and all that is required of them is that at regular intervals once a day they upload new data to the DWH. The DWH represents the source of the only truth needed for responsible decisions at all levels of the company management.
Author: Peter Melich


Aqist, a.s. provides IT solutions and services to companies active in the area of electricity, gas, heating, water and other public services sectors: from consulting through design, implementation to operation, and the complete outsourcing of information systems and services.
